Project Description
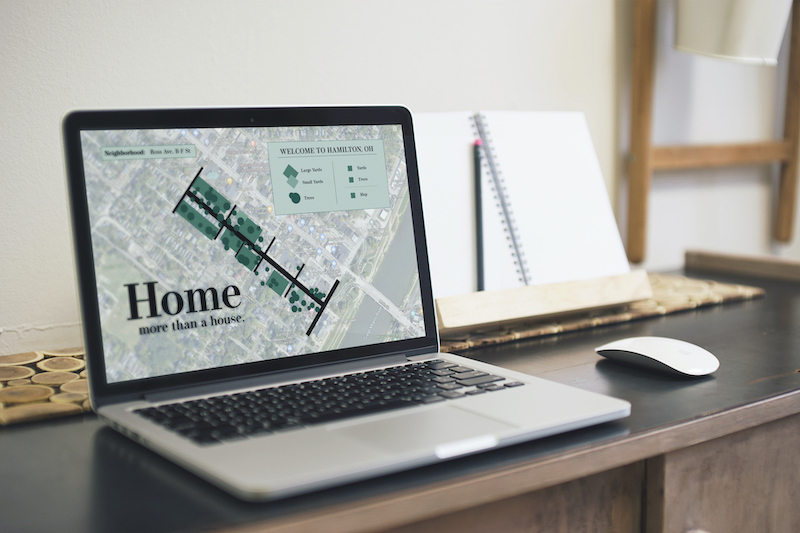
The goal of this project is to create an effective data visualization conveying information about neighborhoods in Hamilton, OH to people considering moving into the area. As the title “Home: more than a house” implies, I decided to focus on data that reaches beyond just the houses in the area. I focused on yard sizes and tree distributions in order to accomplish this. The visualizations work with a website application so that users can choose what information they want to see. The most interesting part of this process, to me, was picking a very specific piece of data to measure and represent the area with just that data.
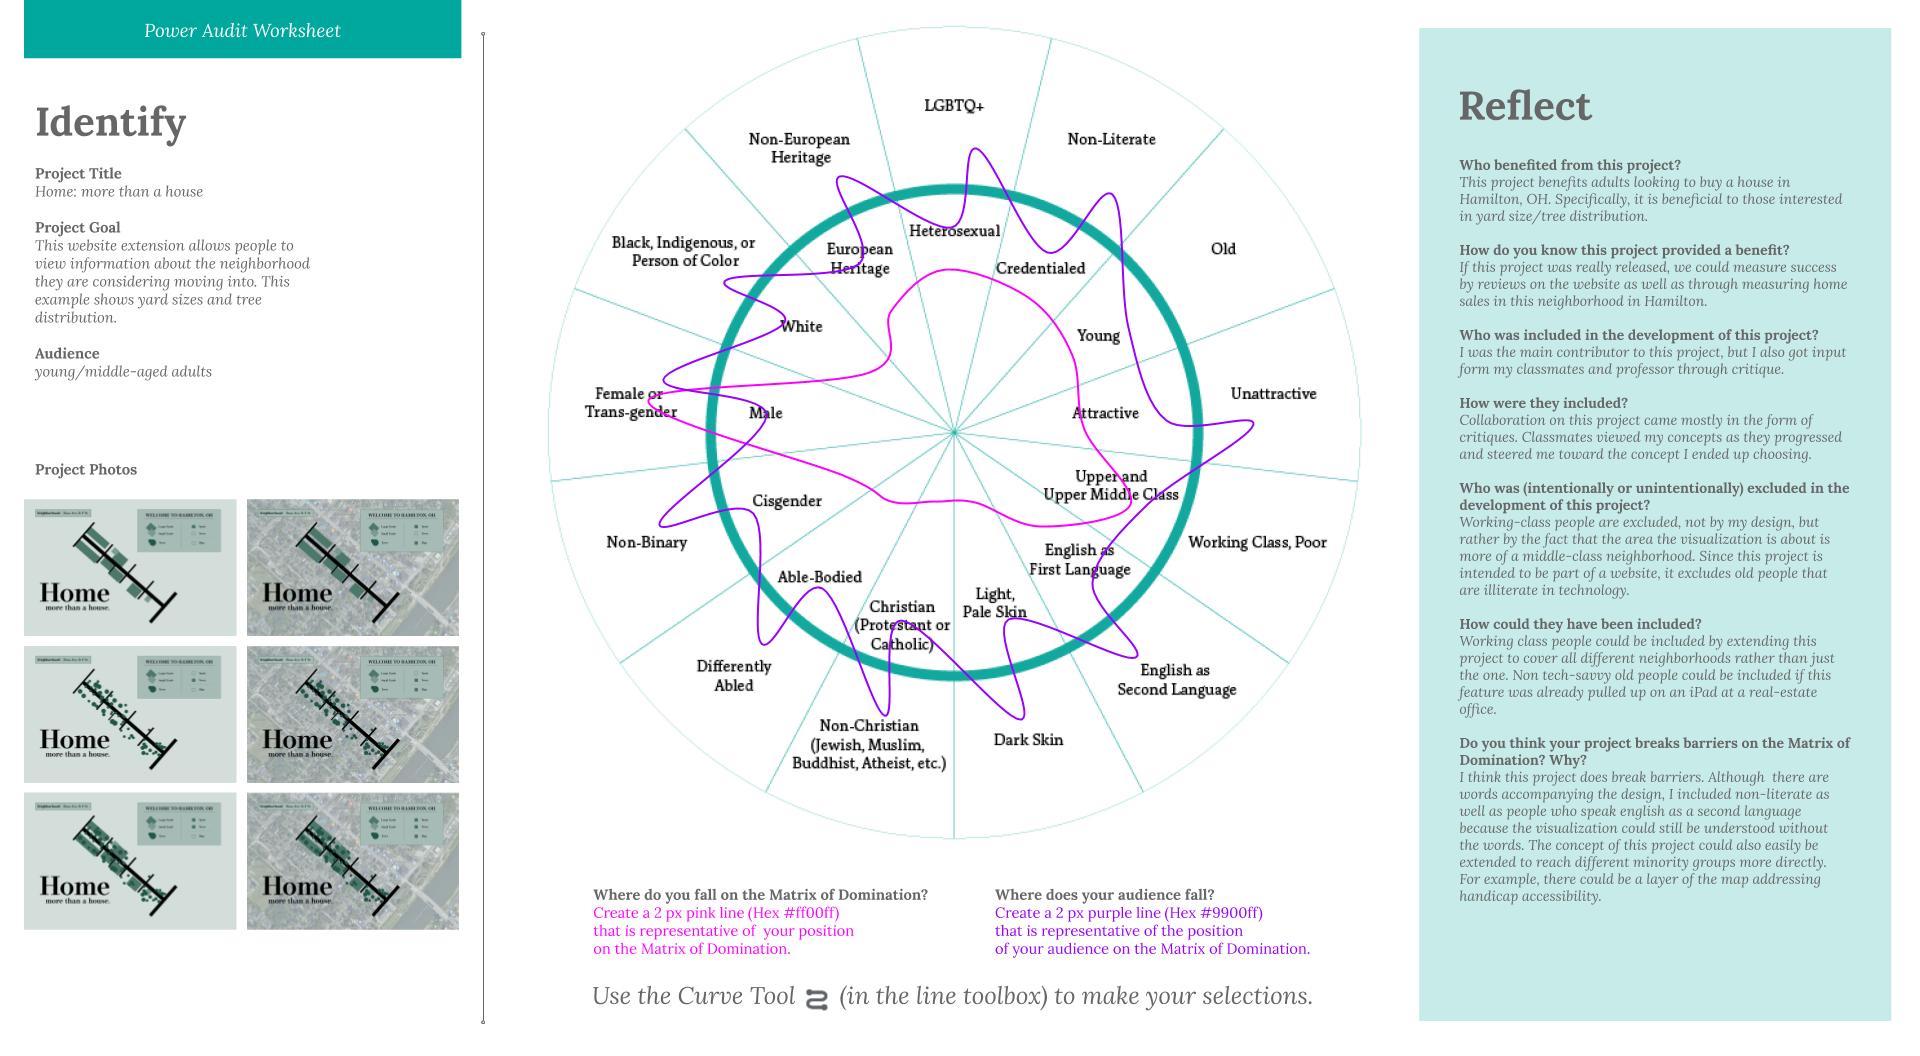
Who Was Included
I was the main contributor to this project, but I also got input from my classmates and professor through critique. Collaboration came mostly in the form of critiques. Classmates viewed my concepts as they progressed, noted which ones were most effective, and steered me toward the concept I ended up choosing.
Research
Research for this project began with becoming educated on how data has been used to represent neighborhoods historically. I listened to the NPR podcast, “A ‘Forgotten History’ of How the U.S. Government Segregated America” about how data has been misconstrued to cause and reinforce segregation. I also read an article on redlining, planned shrinkage, and places of decline. Both of these sources illustrated how the quality of a neighborhood and the demographic of its inhabitants do not happen as organically as many think. Rather, the determination of these qualities is in the hands of those controlling the data, often the government. Seeing how the misuse and misrepresentation of data has caused harm in the past made me aware of how vital it is to represent data as objectively as possible.
Design Approach
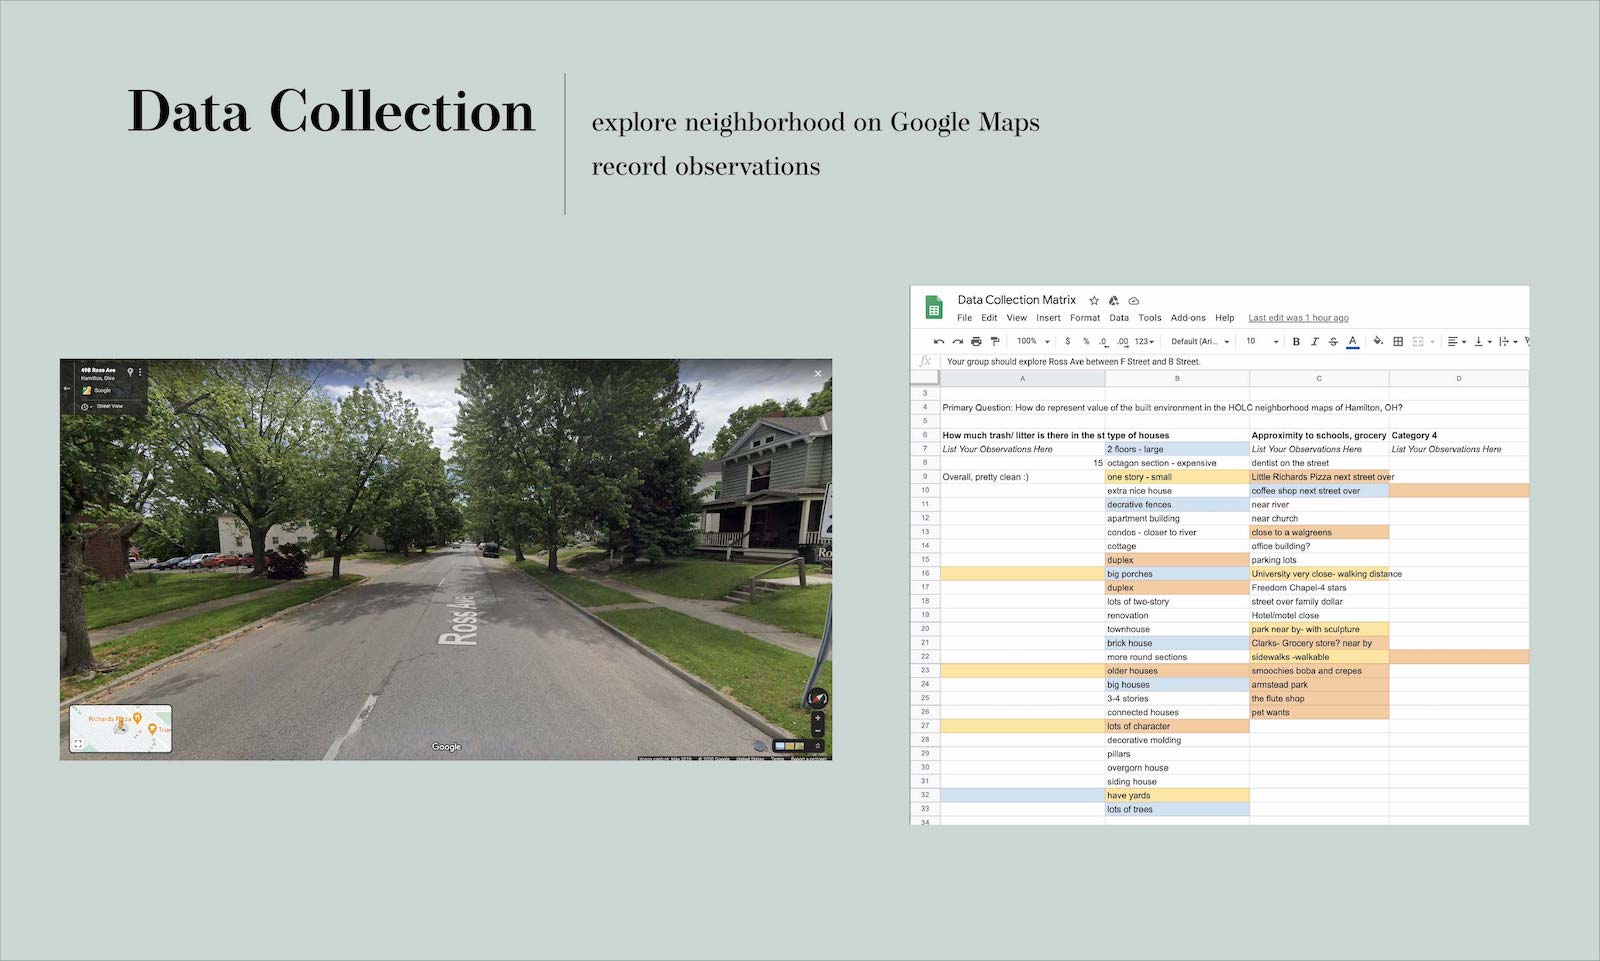
Since data is the key feature of this project, collecting the data was the first step in the design process. We used Google Earth Streetview to get a closer look at the neighborhood and collected data.
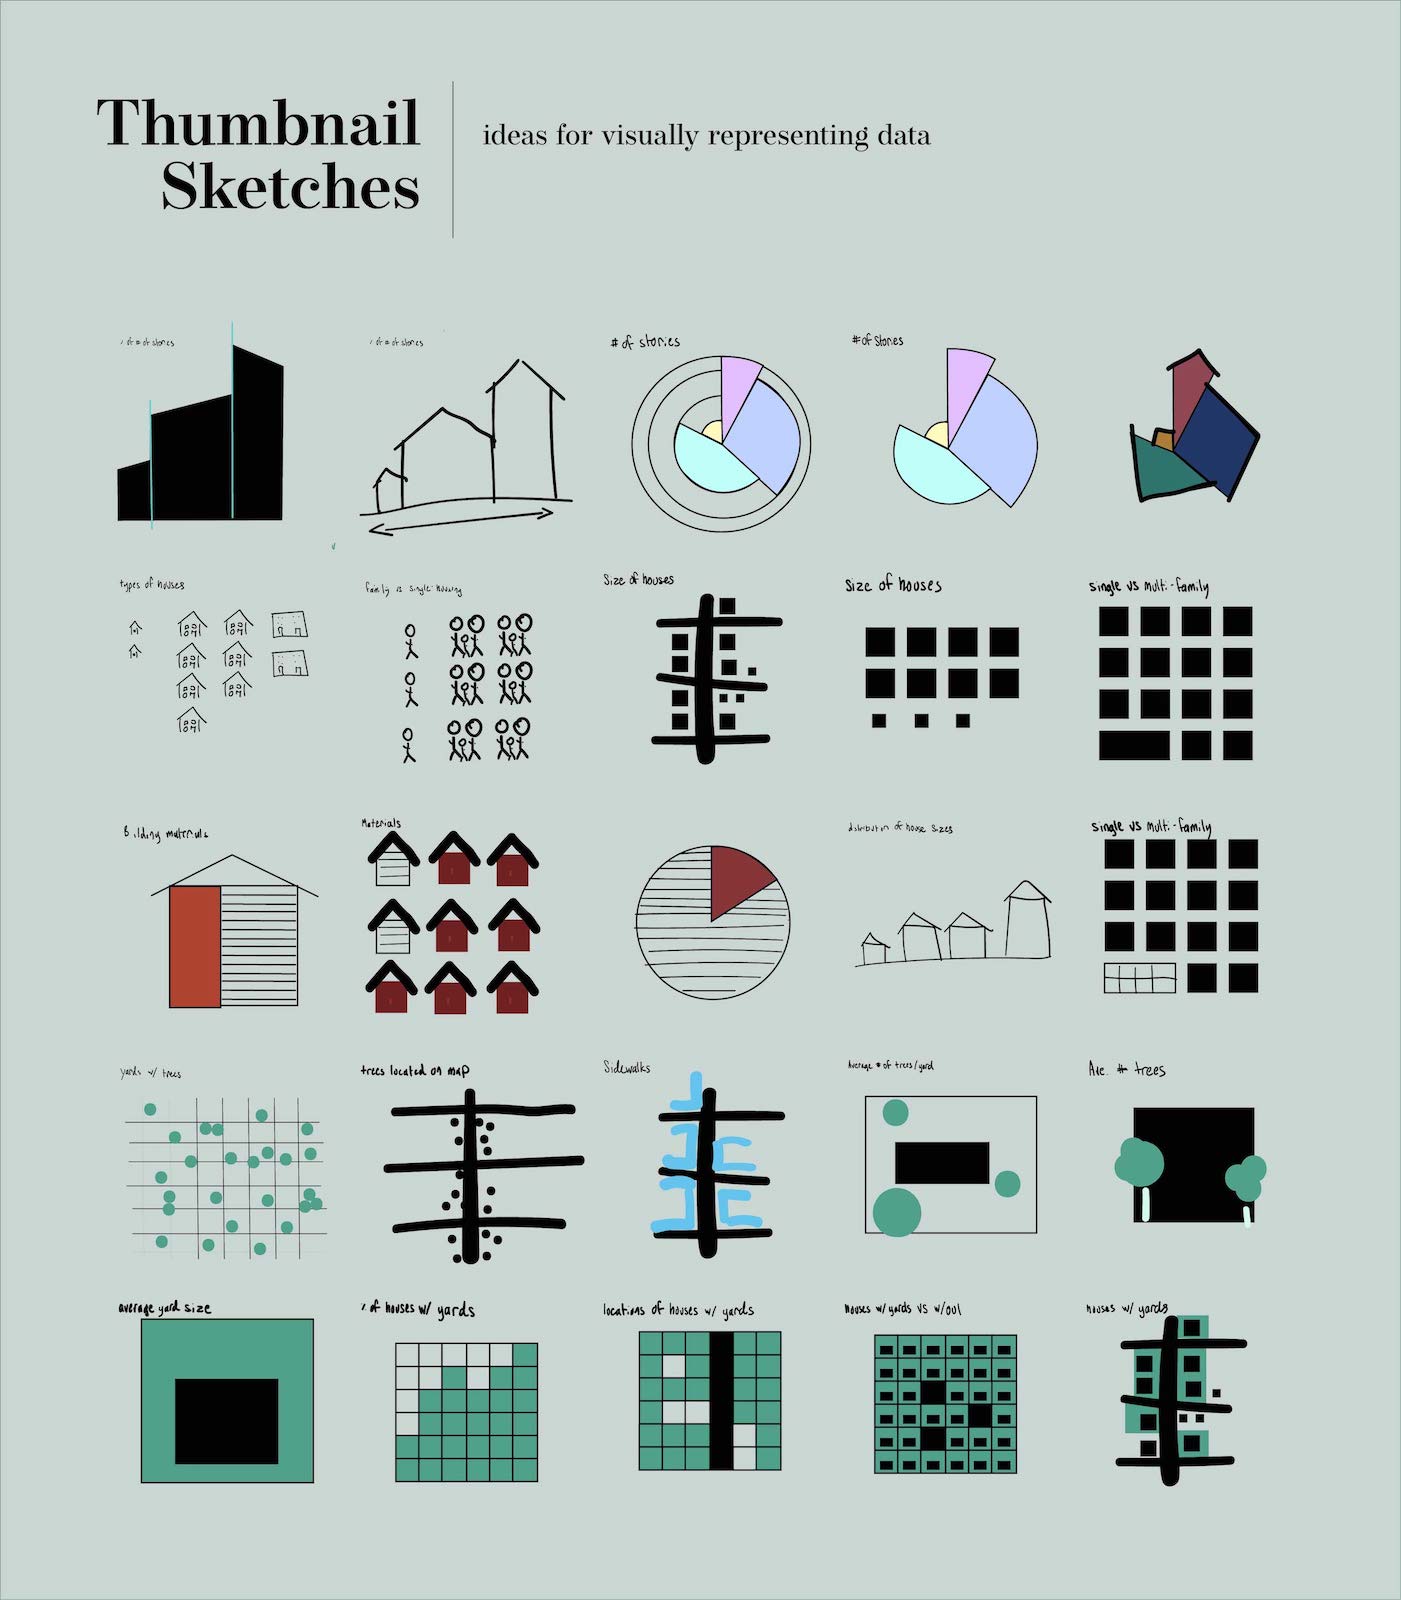
I started with 25 thumbnail sketches exploring potential concepts. Mine revolved around three central themes: house size, yard size, and tree distribution.
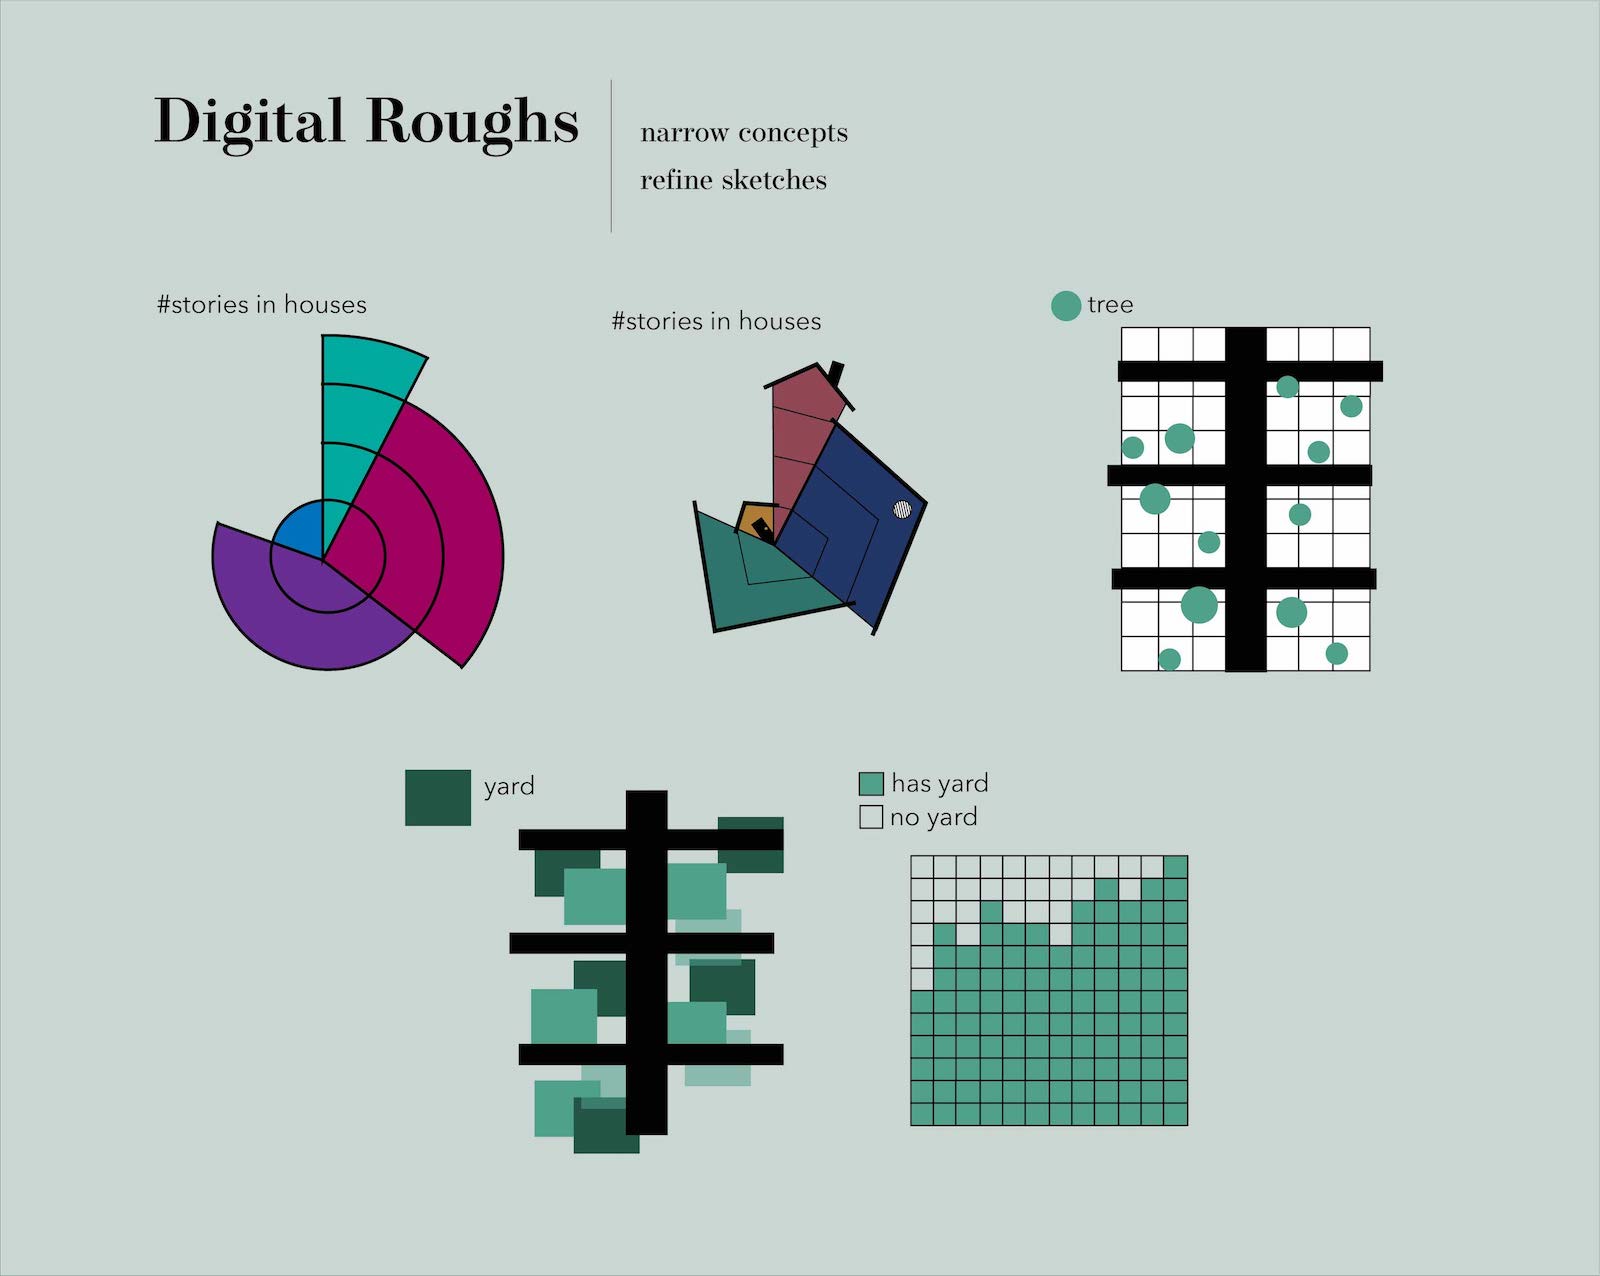
Feedback from the critique on the sketches emphasized the effectiveness of the geometric and gridded layouts for my yard/tree theme as well as the pie chart concept for house size. I refined these concepts into 5 digital roughs. Critiques from the roughs pointed to the conclusion that data on yard size was the most important to my persona, who wanted a large yard.
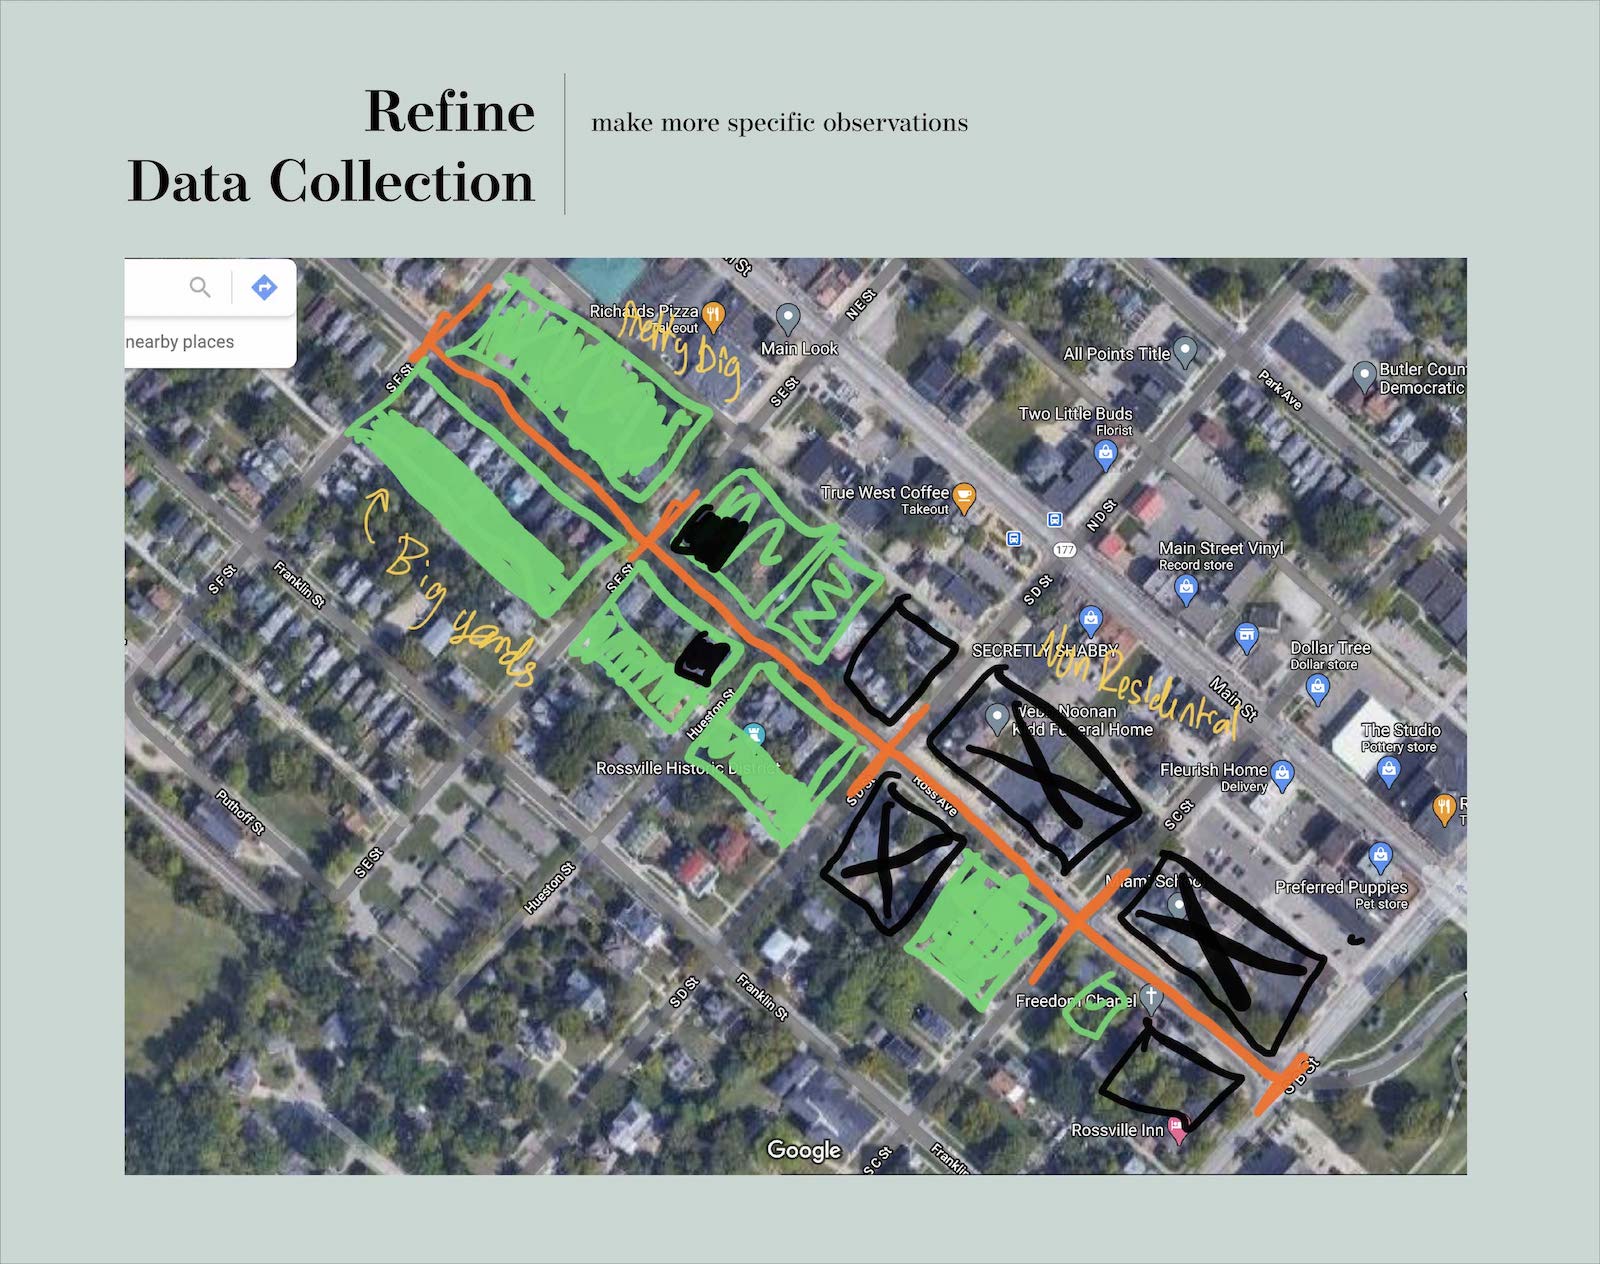
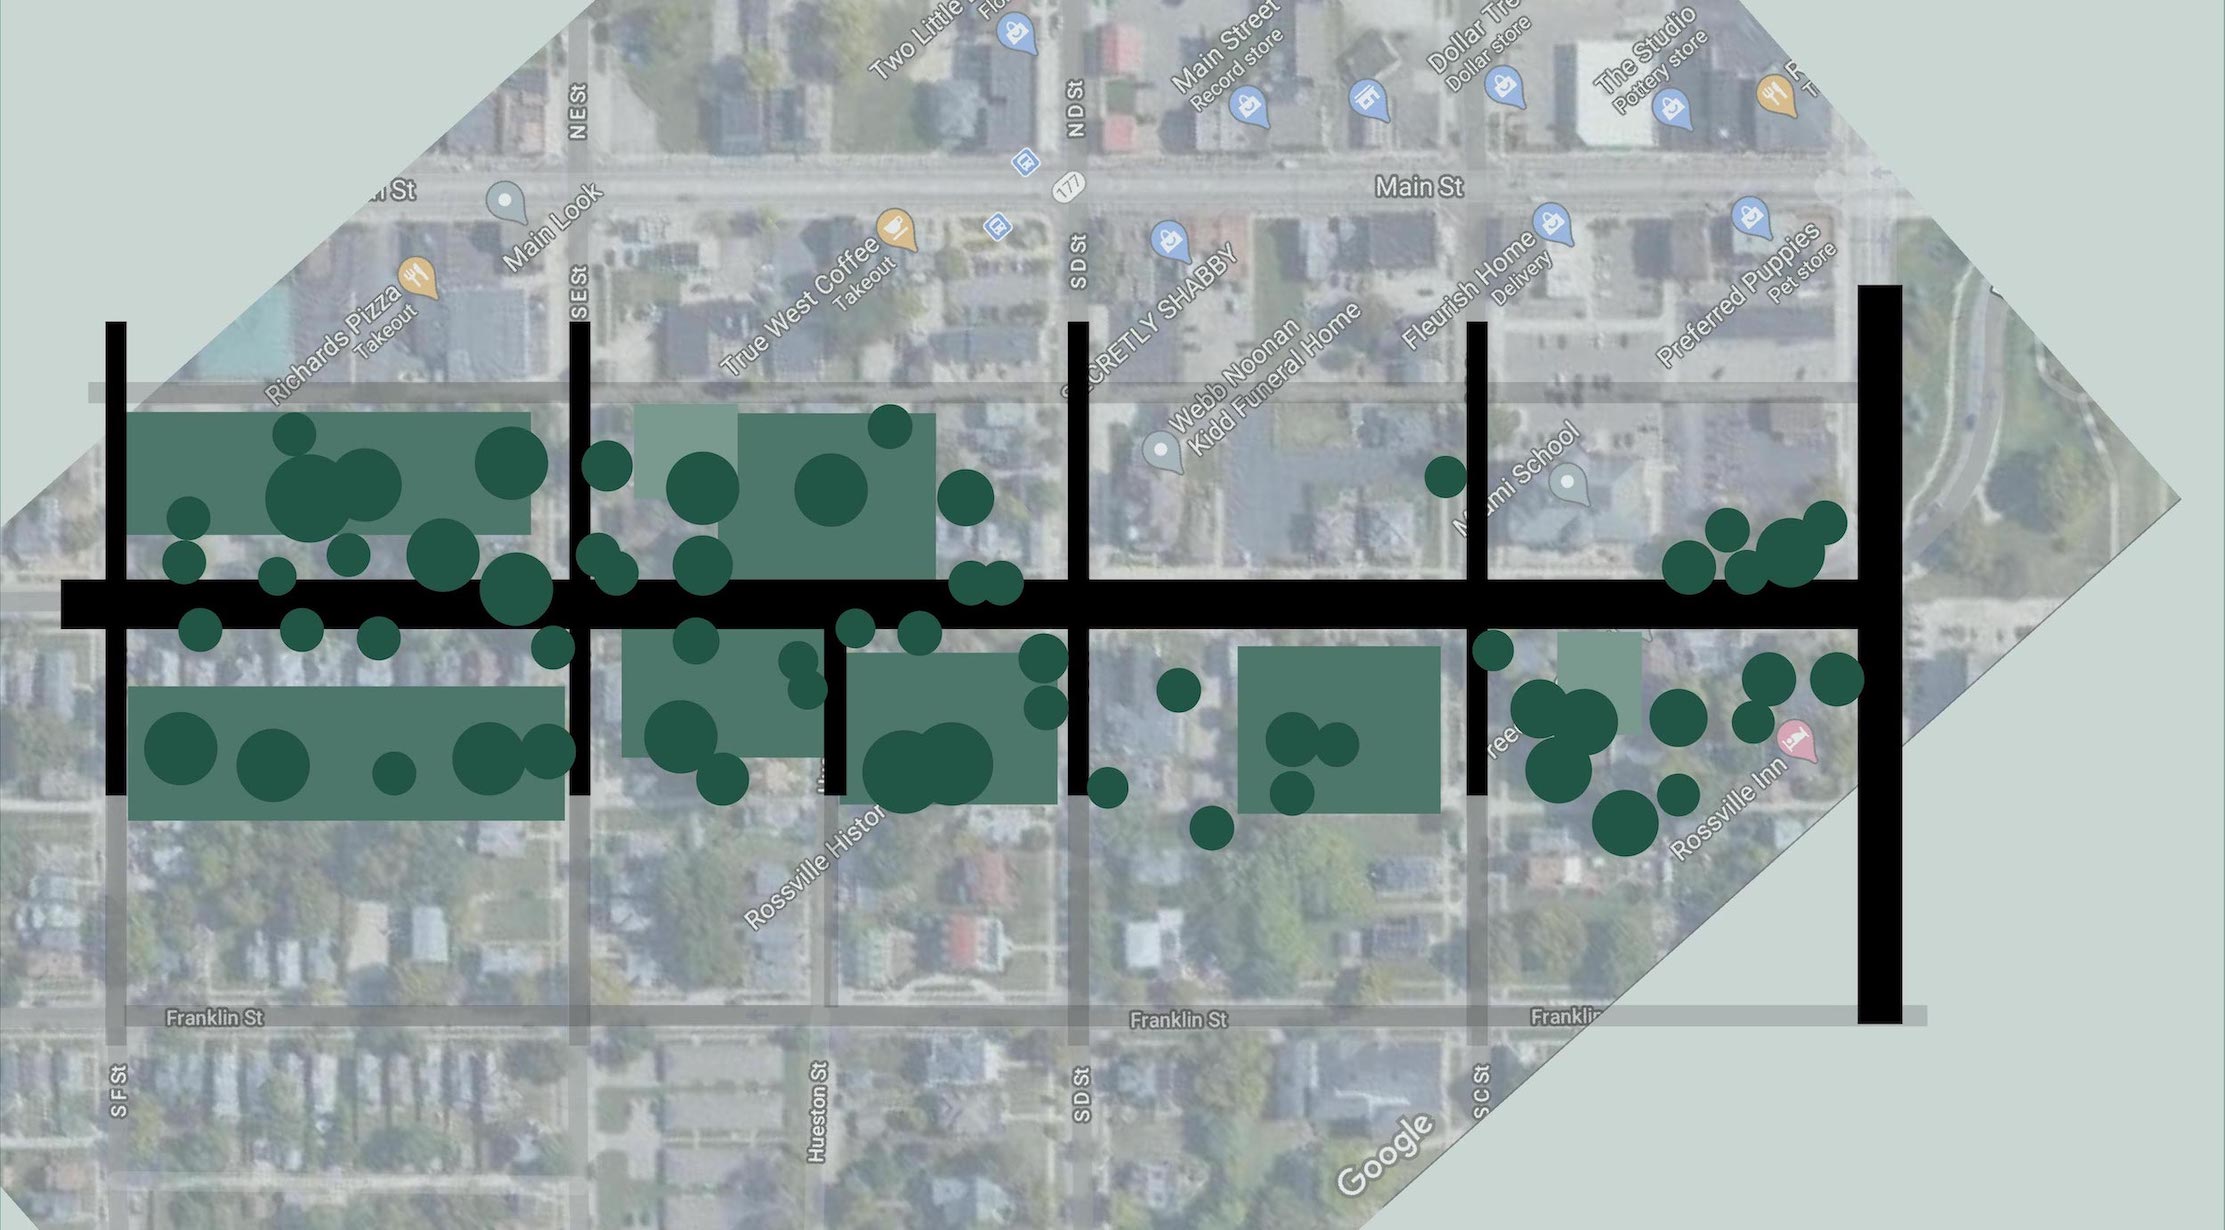
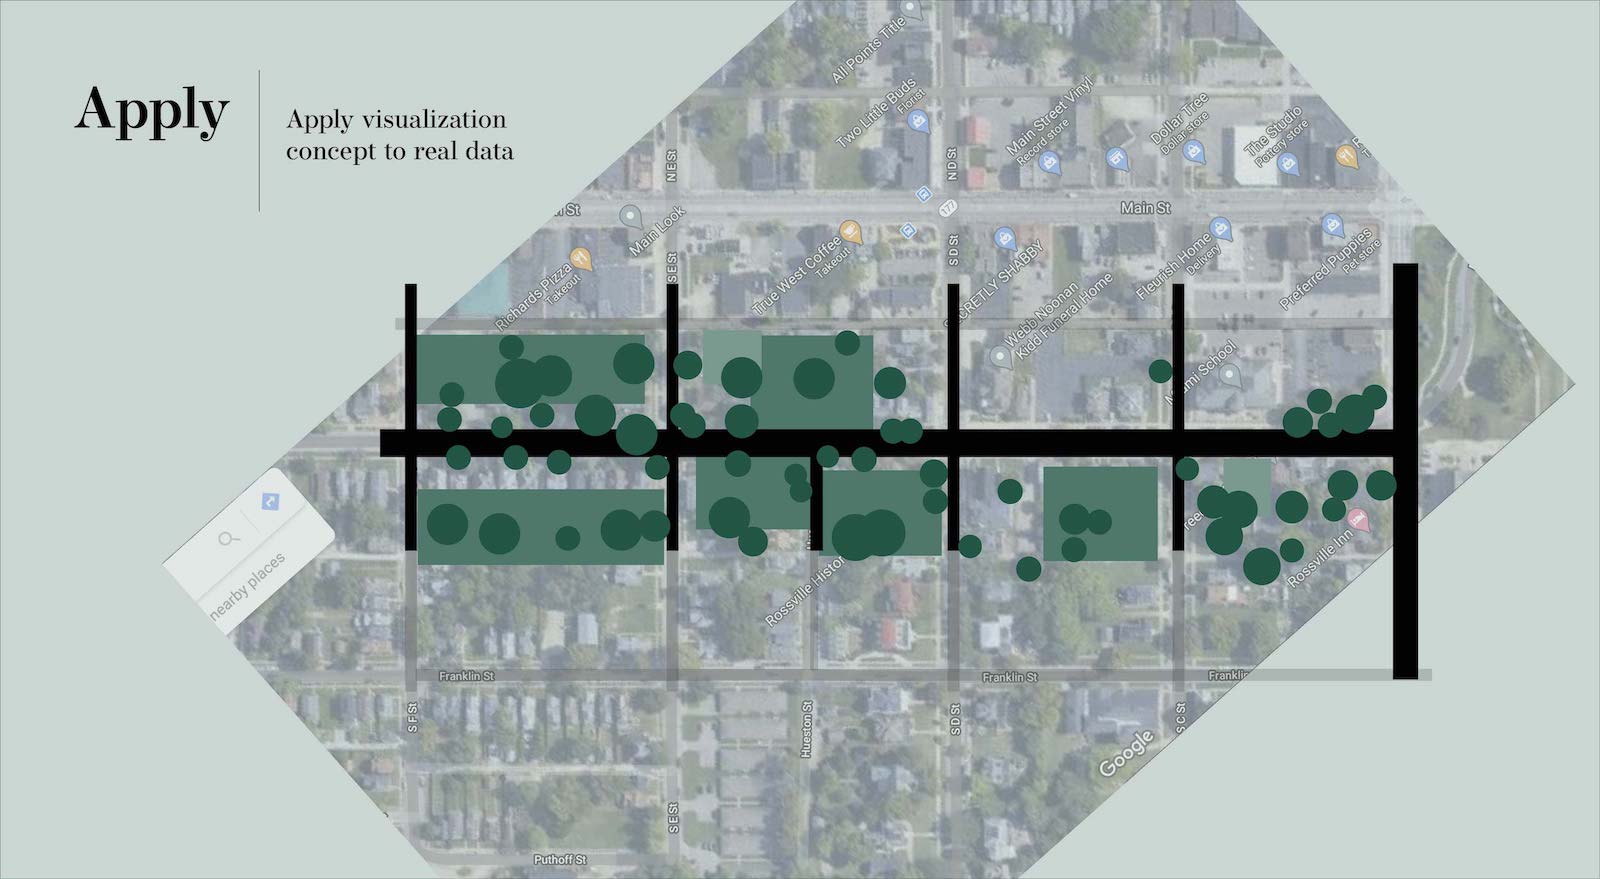
Next I revisited Google Earth to get more exact layouts for my data. After this, I applied my concept directly to the data on the map. Making my design an interactive web application made it possible to break the visualization into layers and allow the viewer to see different views.
Final Deliverable
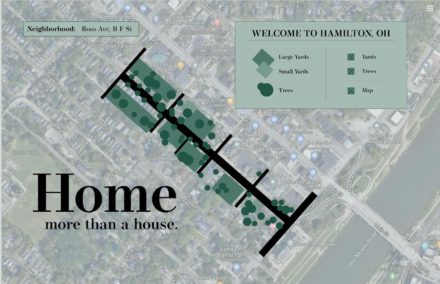
map | trees | yards 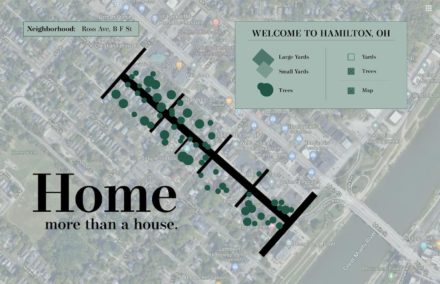
map | trees 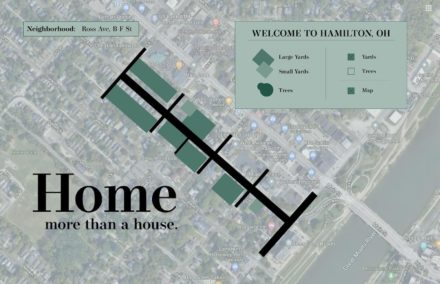
map | yards 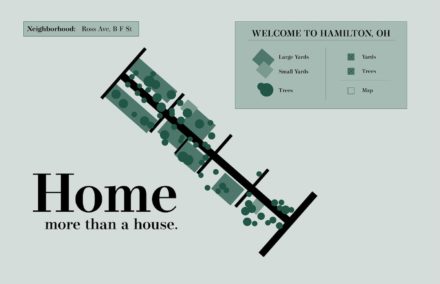
trees | yards 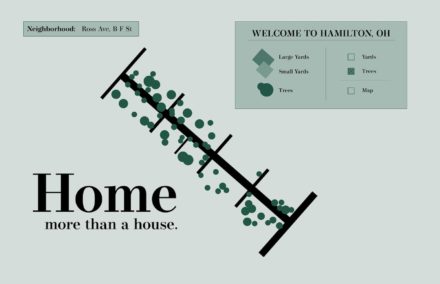
trees 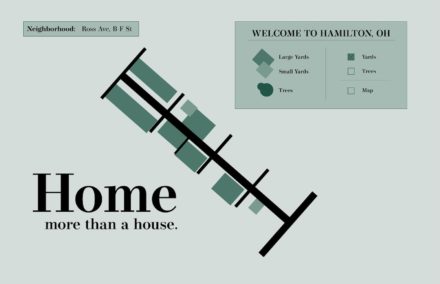
yards
Reflections
I believe my data visualizations convey their information in a clear and easily-understood way. My iterative design process led me to a successful solution. By starting with a wide variety of thumbnail sketches allowed me to explore many different routes and then refine with the help from critiques. My design is largely visually based, which breaks warriors in the matrix of domination by communicating to people who cannot read and/or speak english.
If I were to do this project again or expand upon it, I would apply the same concept to different neighborhoods. This is really the intended purpose of the application, to allow comparison between different neighborhoods. I would also expand the application to include many more layers of different kinds of data such as traffic flow, wheelchair accessibility, or noise levels.